FocalPoints
Vantor's FocalPoints layer provides analyst-curated points of interest, highlighting objects and events of interest on Vantor imagery. New points are continually added.
Opening the FocalPoints Layer
Use the FocalPoints layer to identify recent events and points of interest in the viewport.
-
In the Analytics panel, select the FocalPoints layer. FocalPoints icons and the Analytics legend display.
Viewing Points of Interest in Hub
When working in Hub, you will use the FocalPoints legend, FocalPoints icons, and metadata to learn more about recent events.
-
FocalPoints Legend The FocalPoints legend shows how many FocalPoints events are available for each event type. Select the visibility toggle icon next to any event type to show
 or hide
  that event type. Select Show All or Hide All to show or hide all event types at once. A color-coded time scale at the top of the legend indicates the relative age of each FocalPoints event. Lighter-colored icons are newest; darker-colored icons are oldest.
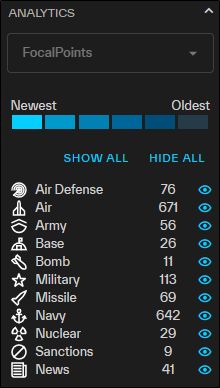
-
FocalPoints Icons FocalPoints icons indicate recent events and points of interest. Select any FocalPoints icon to see metadata pertaining to the recent event or point of interest at that location. Lighter-colored icons are newest; darker-colored icons are oldest.
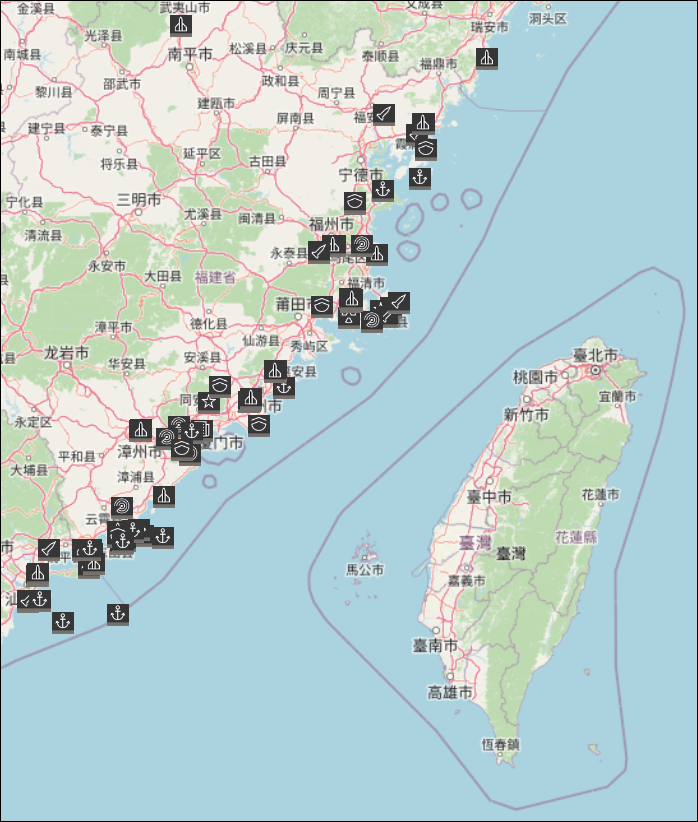
An example of FocalPoints icons indicating recent events in part of China.
 Available FocalPoints Icons
Type of Event
Icon
Air Defense 
Air 
Army 
Base 
Bomb 
Military 
Missile 
Navy 
News

Nuclear

Sanctions

-
FocalPoints Metadata When you select a FocalPoints icon, you will see metadata fields relevant to that event. Quick-search imagery by selecting the linked CatID of the primary image.
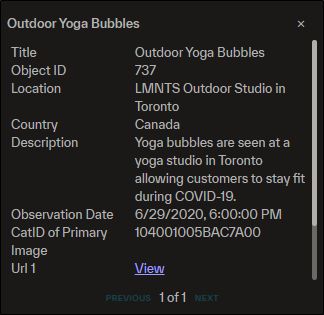
An example of FocalPoints metadata for a news event.
Available Metadata Fields
-
ObjectID
-
Shape
-
Title
-
Country
-
Description
-
Observation Date
-
CatID of Primary Image
-
Secondary Image
-
URL 1
-
URL 2
-
Location
-
POI 1
-
POI 1 Description
-
POI 2
-
POI 2 Description
-
POI 3
-
POI 3 Description
-
Category
-
Date of Secondary Image
Metadata fields only display if they have a value; some events may not show all metadata fields.
If there is more than one
-
-
Additional FocalPoints Viewing Options In the Analytics panel, there are additional options for viewing the FocalPoints layer.
-
Opacity Use the slider to set the opacity of the FocalPoints icons. By default, opacity is set to 100%.
-
Zoom Out Select Zoom Out to zoom to the full extent of the viewport. This allows you to see all available FocalPoints events.
-
Searching and Filtering FocalPoints
You can search and filter for specific FocalPoints events using tools in the Analytics panel.
-
In the Analytics panel, select the FocalPoints layer.
-
Do either of the following:
Filter FocalPoints
-
Select Filters. The FocalPoints Filters dialog opens.
-
Set one or more filters.
-
In the Date Range field, use the calendar picker to select a date range. Optionally, you can select a preset date range of Last Day, Last 7 Days, or Last 30 Days. Click Select.
-
From the Category drop-down, select the category you want to filter by (e.g., Air, Military, News, Sanctions).
-
From the Country drop-down, select the country in which the FocalPoints event should have taken place.
-
-
Select Apply. If events match the filter criteria, they display in the viewport and a counter displays on the Filters button.
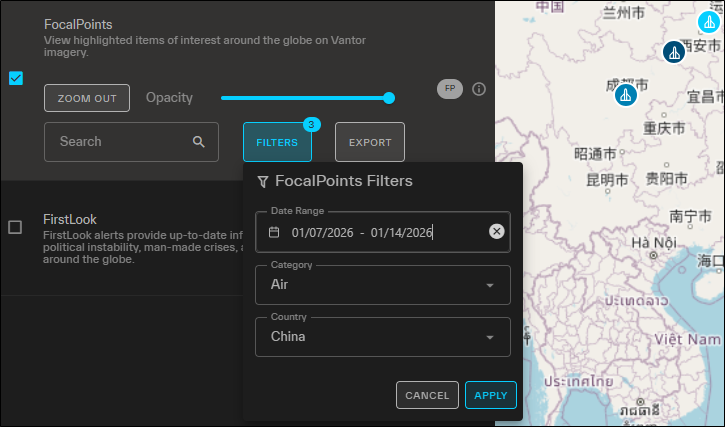
Filtered FocalPoints events. Here, three events match the filter criteria.
To clear filters, in each filter field, select
 , then select Apply.Search for FocalPoints
-
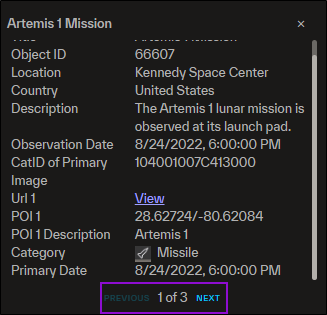
In the Search box, enter a keyword, then press Enter or click Search
 . If events match the search criteria, they display in the viewport.
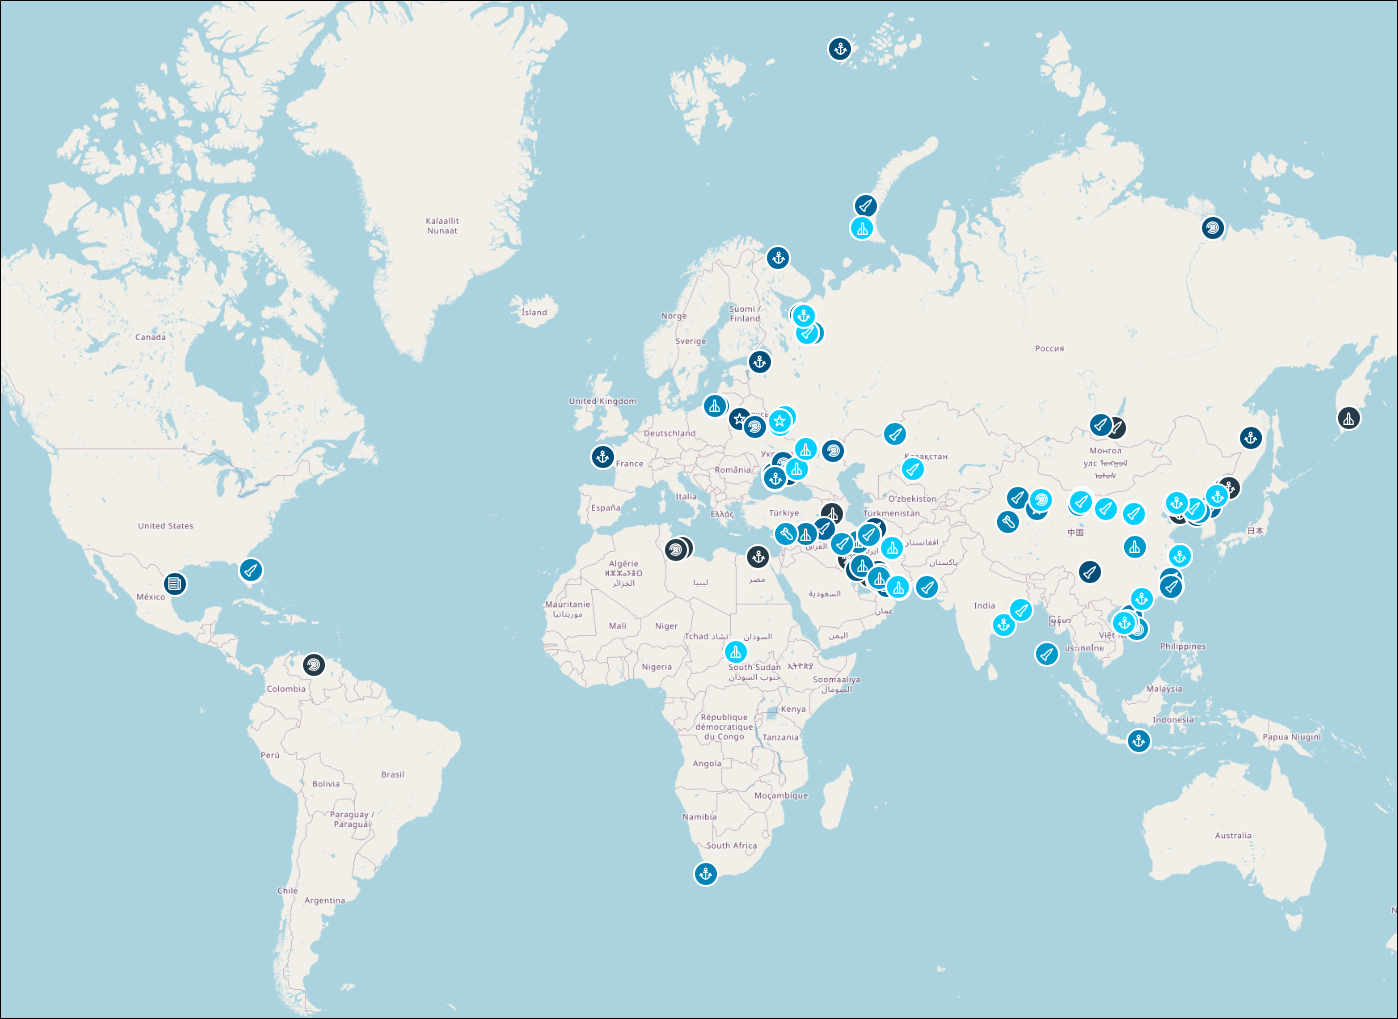
A search for the word "launch" returned the above FocalPoints events, including sub and missile launches, air defense strikes, and the Artemis 1 mission.
-
Exporting FocalPoints Metadata
After you have located your desired FocalPoints events, you can export all visible FocalPoints metadata as a CSV. Visible events are those that you have filtered or searched for (if applicable), are toggled on as visible ![]() in the legend, and are currently within the extent of the viewport.
in the legend, and are currently within the extent of the viewport.
-
In the Analytics panel, select the FocalPoints layer.
-
Filter or search for an event or event type, or toggle visible event types until you are satisfied with the FocalPoints event data.
-
Zoom to the area on the map that you want to include in the export, or select Zoom Out in the Analytics panel to zoom to the full extent of the viewport.
-
Select Export. All visible FocalPoints metadata is exported as a CSV.