Viewing Current Usage
The Overview tab shows your total current usage. Usage is always shown in credits. You can also view additional usage data, such as the total number of credits used.
-
Select a drop-down to view usage metrics.
-
Usage Segment (Default: Days) View your usage for specific usage segments (e.g., day, month, year).
-
Unit of Measure (Default: Credits) View your usage for specific unit types (e.g., credits, map views, square kilometers, gigabytes, feature count).
-
Data Type (Default: Streaming & Orders) View your usage for specific data type (e.g., streaming and orders, only orders, only streaming).
After making your selections, you will see a graph indicating your total usage for the options you selected.
If you selected "month," "credits," and "streaming & orders," you would see a graph of the total number of credits you used that month for all data types.
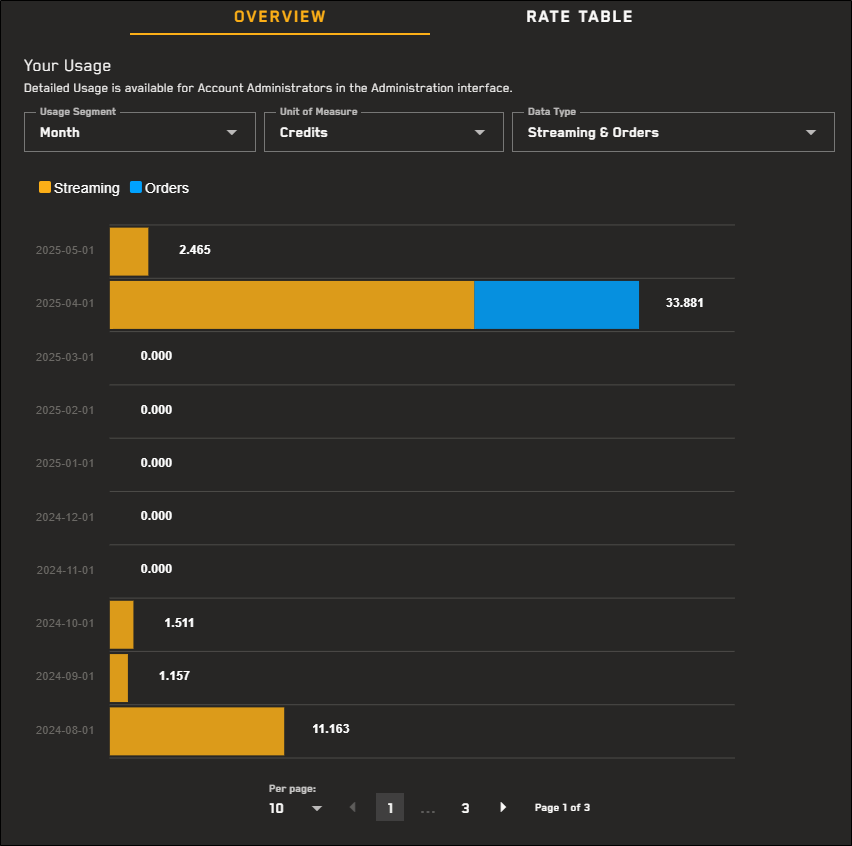
The Overview tab, showing weekly usage measured by credits for all data types. Note that rates shown here are for illustrative purposes only and may not reflect rates in your instance of Hub.
If your usage graph has too many rows to fit on one page, you can change the number of results visible on each page and scroll through each page of results.
-
More About Viewing Usage
-
One map view equals 15 tiles. A tile is 256 x 256 pixels.